客戶服務
-
檢測分析服務
-
Applications Notes 應用文件
-
Webinars 線上學習
-
FAQ 常見問題
HybriD Piezoresponse Force Microscopy: compositional electromechanical study of biopiezoelectrics
Arseny S. Kalinin,NT-MDT Spectrum Instruments
|
|
|
| NT-MDT Spectrum Instruments introduces a new approach for compositional study of topography and electro-mechanical properties of soft and fragile samples. The new AFM mode named HybriD Piezoresponce Force Microscopy (HD PFM) allows simultaneous nondestructive investigation of surface morphology, mapping of quantitative nanomechanical properties and domain morphology of piezoelectrics and ferroelectrics. |
INTRODUCTION
| Atomic force microscopy (AFM) is a powerful tool for surface imaging and examination of local material’s properties with nanometer-level spatial resolution. Since AFM working principle is based on the direct interaction between sharp tip and sample, a variety of unique AFM measurement techniques were developed: quantitative nanomechanical measurements, conductivity mapping, local electromagnetic studies etc. One of these AFM techniques is Piezoresponce Force Microscopy (PFM) – exploring the electromechanical performance of ferroelectrics and piezoelectrics in terms of their domain morphology with nanometer spatial resolution in different environments and various temperatures. Working principle of PFM is based on contact mode AFM – sample scanning technique where tip is constantly pushed into the sample surface with the Feedback-controlled force value. While scanning process the AC voltage is applied between conductive tip and sample causing out-of-plane and in-plane oscillations of the sample according to the domain structure. This allows studying domain geometry, dynamics, local piezoelectric coefficients and polarization direction with AFM tip radius spatial resolution limited by tens of nanometers. Since development by Guthner and Dransfeld in 1991 [1], PFM became widely used technique for ferro- and piezoelectric crystals research. A variety of crystalline materials, whose structure lacks a central symmetry, we explored in terms of piezoelectric domain structure and dynamics [1-4]: lead zirconate titanate, triglycine sulfate, BiFeO3 etc. |
More commonly any material with noncentrosymmetric structure can demonstrate piezoelectric properties. From this point of view the most interesting area for investigation of electromechanical coupling is the life science as long as the majority of proteins, polysaccharides and organelles have noncentrosymmetric nature [5]. Piezoelectricity in biological objects was discovered by Fukada in 1950s for wood and later in 1960s for bone tissue [6-9]. This effect was named biopiezoelectricity. Arising from electromechanical coupling it was further observed for muscle movement nature, nervous system, ion transport, amino acids etc. [10‑16] and became prospective for nanomedicine and biomedical applications. This requires a new tool for investigation of electromechanical coupling in life systems. PFM is great candidate for that purpose since it allows piezoresponce measurement with nanometer-level resolution. But being a contact mode technique, it is unsuitable for biosamples investigation: constant contact of AFM tip with the surface causes significant lateral tip-sample interaction which leads to destroying or deforming of soft and loose objects. Therefore NT-MDT Spectrum Instruments introduces a new approach for PFM investigation of soft and fragile objects utilizing lateral tip-sample interaction – HybriD Piezoresponce Force Microscopy mode (HD PFM). |
INSTRUMENTAL PART
| HD PFM is extension of recently introduced HybriD mode (HD mode) – scanning technique based on fast force-distance curves measurements with real-time processing of tip response [17]. From the hardware point of view, HD PFM is realized using NT‑MDT S.I. new control electronics named HybriD+ (see attachment for detailed specification). In the HD mode, the sample or the tip is driven into a vertical oscillation by a Z piezo-element at the frequency well below the resonances of the probe and the piezo-element. As the probe and the sample interact with each other in every cycle the tip goes from non-touching to touching regime and the cantilever deflects in response to the tip-sample interactions to the specified level. |
This sequence of the events and with an idealized deflection profile of the probe in the single cycle of HD mode is illustrated in Figures 1a-b. As the probe-sample distance shrinks, the cantilever deflection first stays at the baseline level (point 1 in the deflection profile) and then it might bend down in response to adhesive or capillary forces (point 2). On further approach, when the repulsive tip-sample forces dominate, the bending reverses upwards until it reaches the set-point level (point 3) chosen for vertical scanning feedback. This is the turnaround Z-position of the cycle. As the sample and the tip depart, the probe might experience strong adhesive interactions reflected by a well (point 4) in the deflection, before the probe fully detaches from the sample and the cantilever restores its baseline deflection (point 5). |
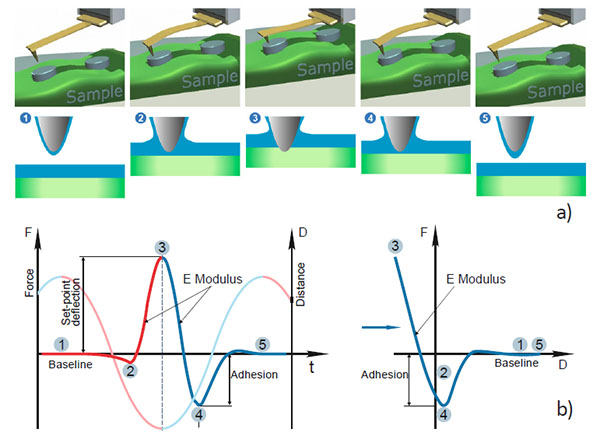
Figure 1. (a) A model illustrating a performance of HD mode (b), an idealized temporal
deflection curve during an oscillatory cycle, (c) the deflection-versus-distance (DvZ)
curves reconstructed from the temporal deflection and vertical distance curves
| The temporal deflection plot contains a wealth of useful information that can be detected, also mapped during lateral scanning and used for the extraction of quantitative local properties of the sample: the approaching and retracting slopes of the plots in the touching part of the cycle are related to the sample elastic modulus (and can be recalculated to the quantitative local Young’s modulus); the attractive wells on the approach or retracting part of the plot can be employed for measurements of adhesion; the baseline level might be influenced by long-distance electrostatic and magnetic forces that are sensed by probes with conducting or ferromagnetic coatings, respectively. These are the well-known features of the temporal deflection plots and related deflection-versus-Z (DvZ) curves (Figure 1c), which have been used for a long time in contact mode studies [18, 19]. The DvZ or force curves in contact mode are practically made at the frequencies in the 0.1 – 10 Hz range, which substantially limits their applications. |
This hurdle is overcome in HD mode where fast data acquisition allows real-time collecting, analyzing and displaying the data recorded in the kHz frequency range. In addition, the deflection variations in different parts of the oscillatory cycle can be detected and processed independently in real-time. One of the features of HD mode is ability of “time window” measurements: ability to switch on AC or DC voltage supply, signal recording and processing in the user-defined part of oscillatory cycle. This feature allowed for example to investigate conductivity of carbon nanotubes by allying DC voltage and detecting tip-sample current signal in the “time window” corresponded to the tip-sample contact (range 2-4 on the Figure 1(b)) [20]. HD PFM mode working principle also based on the “time window” approach (Figure 2). |
d
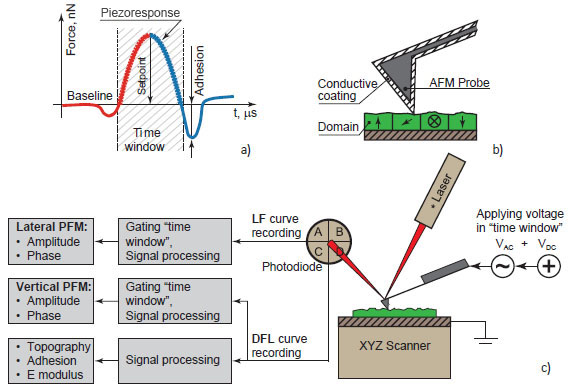
Figure 2. Working principle of HD PFM
| In the user-defined “time window” referred to the tip-sample contact the AC voltage applied between conductive coating of the tip and investigated object. AC voltage causes mechanical oscillations of the sample depending on its local polarization. Corresponding deflection (vertical or “out-of‑plane” oscillations, DFL) and lateral force (lateral or “in‑plane” oscillations, LF) are recorded in defined “time window” and processed to get amplitude and phase signals. |
DFL and LF amplitude signals characterize local piezoelectric coefficient of the material when phase signal gives information about local polarization direction. The full DFL(t) curve of each HybriD mode circle is also processed to calculate adhesion, Young’s modulus and feedback input signals. Thus HD PFM gives complex information about sample’s properties through the single measurement cycle also making PFM unrestrictive due to tip retraction off the sample at each HybriD oscillating cycle. |
RESULTS AND DISCUSSION. COLLAGEN MATRIX
| One of the most interesting biomaterials demonstrating piezoelectrisity is collagen fibrils – the main building component of bones, teeth, corneal stroma and blood vessels. Collagen is composed of aligned polar protein molecules (fibrils) [21] forming strong organic crystalline matrix. Piezoelectric properties of single collagen fibrils were recently studied with nanomenter-level resolution [22,23]. Despite this the scientific challenge of life systems’ piezoresponce study of collagen matrix has not been yet done. The main issue for traditional contact PFM measurements of these structures is complicated surface with height difference of almost one micrometer. This makes AFM tip to cling to the single fibrils highly distorting topography and piezoresponse images. Due to working principle, HD PFM mode was found to be prospective candidate for collagen matrix PFM study. |
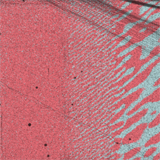
The samples were provided by Fibralign Corporation where a unique technique of animal collagen deposition on glass substrate was developed [24]. Figure 3 demonstrates results of HD PFM study of type I collagen matrix isolated from bovine corneas. Measurements were performed with 280 kHz AC voltage of 8V applied to conductive tip, NT‑MDT S.I. Etalon HA_HR/W2C+ probe was used with force constant 14 N/m. The contrast in (a) covers height variation in 0-800 nm range. Lateral (in-plane) PFM phase in (b) demonstrates the domain distribution, darker and brighter areas correspond to the different direction of polarization. Adhesion in (c) demonstrates tip-sample adhesion force, brighter areas correspond to higher adhesion. E modulus in (d) demonstrates collagen matrix E modulus, brighter areas correspond to higher E modulus. |
Height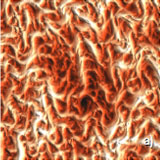 |
LF PFM phase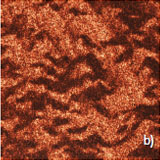 |
Adhesion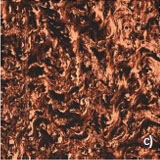 |
Stiffness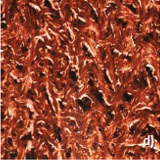 |
| Figure 3. HD PFM images of animal collagen’s matrix. Sample courtesy: M. Paukshto, Fibralign Corp. Images size is 15×15 um. Obtained using NT-MDT S.I. Etalon HA_HR probes with force constant of 14N/m |
|||
RESULTS AND DISCUSSION. PEPTIDE NANOTUBES
| Peptide nanotubes (PNTs) self-assembled from diphenylalanine monomers were recently discovered to exhibit strong piezoelectric properties. Kholkin et al. demonstrated in-plane PFM contrast and high effective d15 piezoelectric coefficient of at least 60 pm/V [25] (for tubes 200 nm in diameter) which is the highest value for known biopiezoelectrics. Together with intrinsic biocompatibility and extremely high Elastic modulus for molecular crystals this makes diphenylalanine PNTs to be very promising materials for developing piezonanodevices that are potentially compatible with human tissue. PNTs are challenging samples for traditional contact PFM investigation due to their fragility and weak contact with a substrate. So there are no PFM images of non-destroyed tubes can be found in the literature. In contrast HD mode was recently demonstrated to be nondestructive tool for investigation of thin PNTs (around 10 nm in diameter) of another type in terms of obtaining information on topography, adhesion and Young’s modulus [20]. |
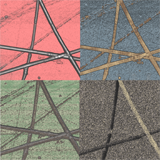
Therefore, it was logical to apply HD PFM to diphenylalanine PNTs in order to measure piezoresponse, mechanical and electrostatic properties. Figures 4 and 5 demonstrate non-destructive compositional electromechanical studies of peptide nanotubes for the first time: topography, lateral PFM response, E modulus, adhesion and electrostatic properties maps were obtained simultaneously. Measurements were performed with 40 kHz AC voltage of 10V applied on conductive tip coating, NT-MDT NSG30/TiN probe was used with force constant of 45 N/m. Lateral PFM phase demonstrates PNTs with opposite polarization direction corresponding to d15 piezoelectric constant (vertical electric field and polarization parallel to the tube axis). The elastic modulus was obtained to be 10 GPa that corresponds to the value known from literature [26]. |
Height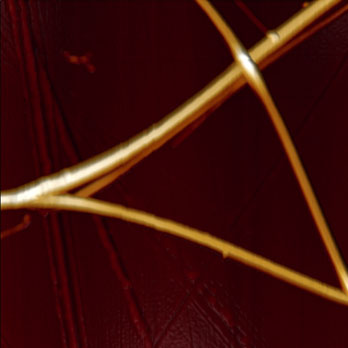 |
In-plane PFM Phase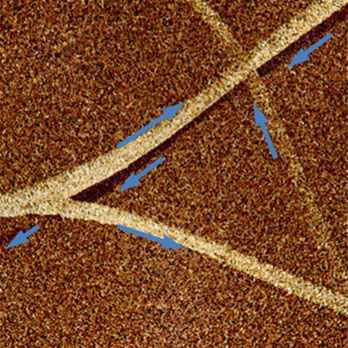 |
Work of Adhesion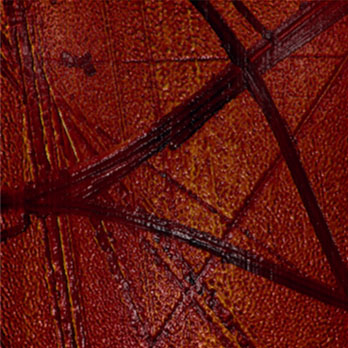 |
EFM Phase, d2C/dz2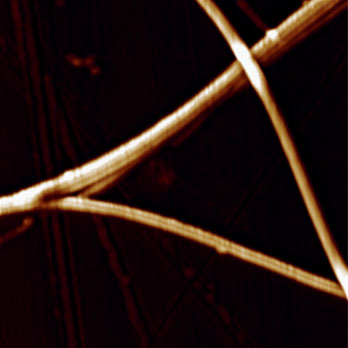 |
| Figure 4. HD PFM images of peptide nanotubes of diphenylalanine. Scan size: 8×8 µm. Sample courtesy: A.L. Kholkin, University of Aveiro. Image size 5×5 µm. The tubes size is 250-300 nm. Lateral PFM phase demonstrates tubes with opposite polarization directions. Dark area on adhesion map corresponds to less adhesion, EFM Phase image demonstrated d2C/dz2 value distribution | |||
Topography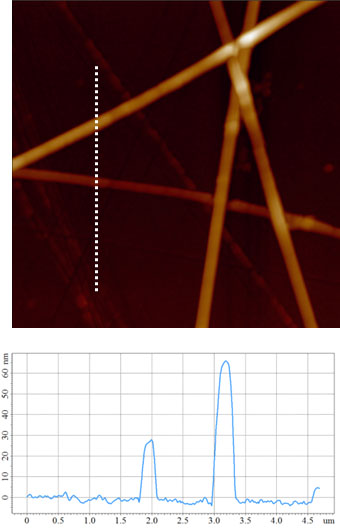 |
In-plane PFM Phase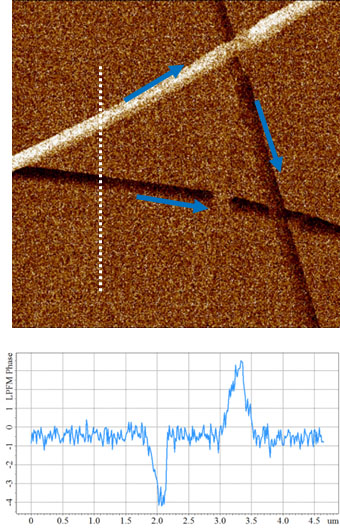 |
E modulus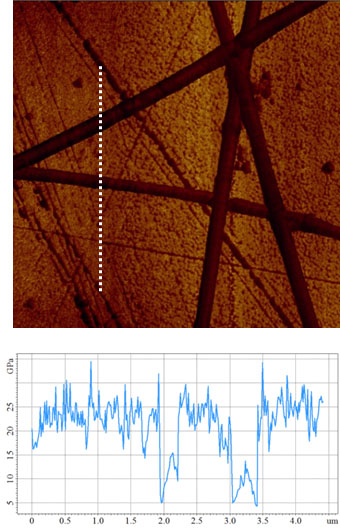 |
| Figure 5. HD PFM images of peptide nanotubes of diphenylalanine. Scan size: 8×8 µm. Sample courtesy: A.L. Kholkin, University of Aveiro. Image size 5×5 µm. The tubes size is 40-70 nm. Lateral PFM phase demonstrates tubes with opposite polarization directions. Elastic modulus of 10 GPa was obtained. | ||
CONCLUSION
| This application note demonstrated a new approach for nondestructive compositional electro-mechanical studies of soft and fragile piezoelectrics. Introduced HD PFM mode was successfully applied for simultaneous investigation of topography and local piezoresponce, adhesion and E modulus of challenging biosamples – corneal stoma collage matrix and self-assembled diphenylalanine peptide nanotubes. | HD PFM opens up new horizons for atomic force microscopy implementation in a field of biopiezoelectrics and other areas of material science where conventional PFM is inapplicable. |
REFERENCES
|
1. Guthner, P., Dransfeld, K.: Local poling of ferroelectric polymers by scanning force microscopy, Appl. Phys. Lett. 61(9), 1137–1139 (1992). 2. Gruverman, A., Auciello, O. and Tokumoto, H.: Scanning Force Microscopy for the Study of Domain Structure in Ferroelectric Thin Films. J. Vac. Sci. Technol. B 1996, 14, pp. 602-605. 3. Kalinin, S. V. and Bonnell D. A.: Imaging mechanism of piezoresponse force microscopy of ferroelectric surfaces. Phys. Rev. B 2002, 65, 125408. 4. Kholkin, A. L., Kalinin, S. V., Roelofs, A. and Gruverman, A.: Review of ferroelectric domain imaging by piezoresponse force microscopy (in Scanning Probe Microscopy, Kalinin, S., Gruverman, A. eds.), vol 1, pp. 173–214, Springer, New York, 2007. 5. Bystrov, V. S., Bdikin, I., Heredia, A., Pullar, R. C., Mishina, E., Sigov, A.S., Kholkin, A.L.: Piezoelectricity and Ferroelectricity in Biomaterials : From Proteins to Self-assembled Peptide Nanotubes (in Piezoelectric Nanomaterials for Biomedical Applications, Ciofani, G., Menciassi, A. eds.), pp. 187–211. Springer, New York, 2012. 6. Fukada, E.: Vibrational study of the wood used for the sound boards of pianos. Nature 166, pp. 772–773, 1950 7. Fukada, E.: Piezoelectricity of wood. J. Phys. Soc. Jpn. 10, pp. 149–154, 1955 8. Fukada, E., Yasuda, I.: On the piezoelectric effect of bone. J. Phys. Soc. Jpn. 12, pp. 1158‑1162, 1957 9. Fukada, E., Yasuda, I.: Piezoelectric effects in collagen. Jpn. J. Appl. Phys. 3, pp. 117–121, 1964 10. Leuchtag, H.R.: Voltage-Sensitive Ion Channels: Biophysics of Molecular Excitability. Springer, Dordrecht (2008) 11. Leuchtag, H. R., Bystrov, V. S., Theoretical models of conformational transitions and ion conduction in voltage-dependent ion channels: Bioferroelectricity and superionic conduction. Ferroelectrics 220 (3-4), 157-204(1999) 12. Amdursky, N., Beker, P., Schklovsky, J., Gazit, E., Rosenman, G.: Ferroelectric and related phenomena in biological and bioinspired nanostructures. Ferroelectrics 399, 107‑117 (2010) 13. Athenstaedt, H.: Permanent Longitudinal Electric Polarisation and Pyroelectric Behaviour of Collagenous Structures and Nervous Tissue in Man and other Vertebrates. Nature 228, 830‑834 (1970) |
14. Athenstaedt, H.: Pyroelectric and piezoelectric properties of vertebrates. Ann. NY Acad. Sci. 238, 68–94 (1974) 15. Lemanov, V.V., Popov, S.N., Pankova, G.A.: Piezoelectric properties of crystals of some protein aminoacids and their related compounds. Phys. Sol. Stat. 44, 1929–1935 (2002) 16. Lemanov, V.V., Popov, S.N., Pankova, G.A.: Protein amino acid crystals: Structure, symmetry, physical properties. Ferroelectrics 285, 581–590 (2003) 17. Magonov, S.N.: Expanding Atomic Force Microscopy with HybriD Mode Imaging. NT-MDT Spectrum Instruments Application Note 087. 18. Weisenhorn, A. L., Hansma, P. K., Albrecht, T. R. and Quate, C. F.: Forces in atomic force micros¬copy in air and water. Appl. Phys. Lett. 1989, 54, 2651-2653. 19. Burnham, N. A. and Colton, R. J.: Measuring the nanomechanical properties and surface forces of materials using an atomic force microscope. J. Vac. Sci. Technol. A 1989, 7, 29 06–2913. 20. Montenegro, J., Vazquez-Vazquez, C., Kalinin, A.S., Geckeler, K.E., Granja, J.R.: Coupling of peptide and carbon nanotubes. J. Am. Chem. Soc., 2014. 21. Athenstaedt, H.: Pyroelectric and piezoelectric properties of vertebrates. Ann. NY Acad. Sci. 238, 68–94 (1974) 22. Minary-Jolandan, M., Yu, M.F.: Nanoscale characterization of isolated individual Type I collagen fibrils: Polarisation and piezoelectricity. Nanotechnology 20, 85706 (2009) 23. Minary-Jolandan, M., & Yu, M. F.: Uncovering nanoscale electromechanical heterogeneity in the subfibrillar structure of collagen fibrils responsible for the piezoelectricity of bone. ACS Nano, 3(7), pp. 1859–1863 (2009) 24. Muthusubramaniam, L., Peng, L., Zaitseva, T., Paukshto, M., Martin, G. R., & Desai, T. A.: Collagen fibril diameter and alignment promote the quiescent keratocyte phenotype. Journal of Biomedical Materials Research. Part A, 100 A(3), pp. 613–621 (2012). 25. Kholkin, A., Amdursky, N., Bdikin, I., Gazit, E., & Rosenman, G.: Strong piezoelectricity in bioinspired peptide nanotubes. ACS Nano, Vol. 4, pp. 610–614 (2010) 26. Zelenovskiy, P., Kornev, I., Vasilev, S. Kholkin, A. On the origin of the great rigidity of self-assembled diphenylalanine nanotubes. Phys. Chem. Chem. Phys. 18, 29681–29685 (2016). 2 |